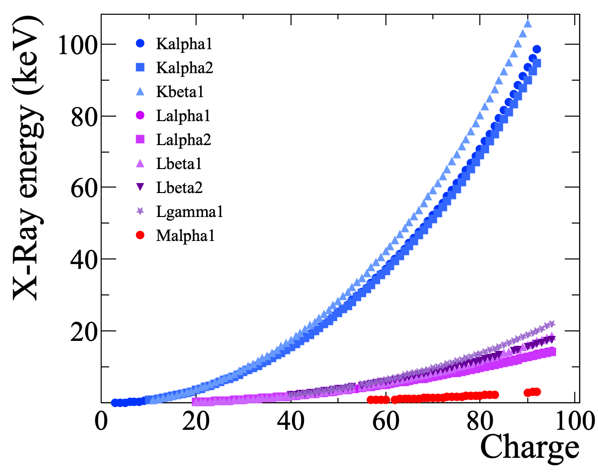
This example macro loops on the different elements of the periodic table and plot the different x-rays energy
#include "Rtypes.h"
#include "TROOT.h"
#include "TGraph.h"
#include "TCanvas.h"
#include "TAxis.h"
#include "TMultiGraph.h"
#include "tkmanager.h"
void draw_xrays()
{
gROOT->SetStyle("tkn-histo");
auto *canvas = new TCanvas();
vector<tkstring> xrays_names {"Kalpha1","Kalpha2","Kbeta1" ,"Lalpha1","Lalpha2" ,"Lbeta1" ,"Lbeta2" ,"Lgamma1" ,"Malpha1"};
vector<int> xrays_colors{ kAzure , kAzure-2, kAzure-4, kViolet , kViolet-2, kViolet-4, kViolet-6, kViolet-8, kRed };
vector<int> xrays_style { 20 , 21 , 22 , 20 , 21 , 22 , 23 , 29 , 20 };
map<tkstring,TGraph*> xrays_graphs;
TMultiGraph *multigraph = new TMultiGraph("draw_xrays","draw_xrays");
multigraph->GetXaxis()->SetTitle("Charge");
multigraph->GetYaxis()->SetTitle("X-Ray energy (keV)");
for(size_t i=0 ; i<xrays_names.size() ; i++) {
TGraph *g = new TGraph;
g->SetNameTitle(xrays_names.at(i).data(),xrays_names.at(i).data());
g->SetMarkerStyle(xrays_style.at(i));
g->SetMarkerSize(1);
g->SetMarkerColor(xrays_colors.at(i));
g->GetXaxis()->SetTitle("Charge");
g->GetYaxis()->SetTitle("X-Ray energy (keV)");
xrays_graphs[xrays_names.at(i)] = g;
multigraph->Add(g,"lp");
}
for(const auto &znucs : gmanager->get_map_of_nuclei_per_z()) {
auto xrays = nuc.get_xrays();
for(const auto &xray: xrays) {
TGraph *g = xrays_graphs[xray->get_type().copy().remove_all("XRay_")];
g->AddPoint(nuc.get_z(),xray->get_value());
}
}
multigraph->Draw("apl");
canvas->BuildLegend(0.20903,0.477895,0.419732,0.932632,"","p");
canvas->SaveAs("draw_xrays.png");
}
Represents a nucleus and provides access to its properties.